Power BI is not only about creating charts and dashboards. The quality of a Power BI report depends heavily on how the underlying data is organized.
After cleaning and transforming data with Power Query, the next important step is data modelling in Power BI.
Data modelling helps Power BI understand how different tables are connected. It also improves report accuracy, simplifies DAX calculations and makes dashboards easier to maintain.
For learners exploring Power BI training in KPHB, understanding relationships, fact tables, dimension tables and star schema is an important step toward building professional business intelligence solutions.
What Is Data Modelling in Power BI?
Data modelling in Power BI is the process of organizing data tables and creating relationships between them so that information can be analyzed correctly across multiple datasets.
For example, an organization may store information in different tables such as:
- Sales
- Customers
- Products
- Employees
- Locations
- Dates
These tables contain different types of information, but they are connected through common fields such as:
- Customer ID
- Product ID
- Employee ID
- Date
- Location ID
Power BI uses these relationships to combine information and produce meaningful reports.
Why Is Data Modelling Important in Power BI?
Data modelling is one of the core skills required for professional Power BI development.
A good data model helps improve:
Accurate Reporting
Relationships between tables help Power BI calculate values correctly across different datasets.
Better DAX Calculations
DAX formulas become easier to create when the underlying model is properly structured.
Report Performance
A clean and optimized model can improve dashboard loading speed and reduce unnecessary data processing.
Easier Maintenance
Well-organized models are easier to understand, troubleshoot and update.
Better Business Analysis
Users can analyze information by:
- Product
- Customer
- Region
- Employee
- Month
- Year
- Department
without creating one massive table.
What Are Relationships in Power BI?
A relationship in Power BI connects two tables through a common column.
Consider the following example.
Customers Table
| Customer ID | Customer Name |
|---|---|
| C101 | Ravi |
| C102 | Priya |
| C103 | Arjun |
Sales Table
| Order ID | Customer ID | Sales Amount |
|---|---|---|
| O101 | C101 | ₹5,000 |
| O102 | C102 | ₹8,500 |
| O103 | C101 | ₹3,200 |
The common column here is:
Customer ID
Power BI can connect both tables using this field.
Once the relationship is created, users can analyze sales by customer name even though the information is stored in separate tables.
Types of Relationships in Power BI
Power BI supports different relationship types.
One-to-Many Relationship
This is one of the most commonly used relationships.
Example:
One Customer → Many Sales Transactions
A single customer can place multiple orders.
This type of relationship is widely used in Power BI data models.
One-to-One Relationship
A one-to-one relationship means one record in one table matches exactly one record in another table.
Example:
Employee ID → Employee Profile
This relationship is less common than one-to-many in analytical models.
Many-to-Many Relationship
A many-to-many relationship occurs when multiple records from one table can relate to multiple records in another table.
These relationships can be useful, but they should be handled carefully because they may make a model more complex.
What Is a Star Schema in Power BI?
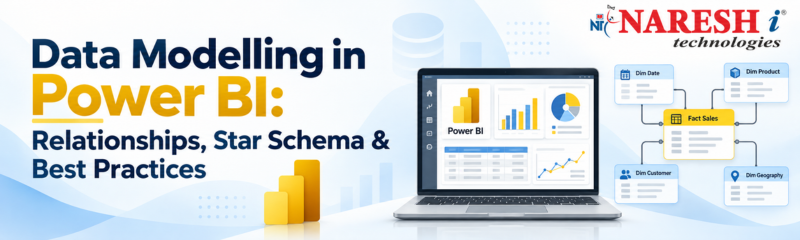
A star schema is a data modelling structure where one central fact table is connected to multiple dimension tables.
It is one of the most common approaches used in business intelligence and data analytics.
A simple star schema may look like this:
Customers
↓
Products → Sales ← Dates
↑
Locations
The Sales table acts as the central table, while other descriptive tables are connected around it.
Because the structure looks similar to a star, it is called a star schema.
Fact Table vs Dimension Table
Understanding fact and dimension tables is important for Power BI data modelling.
What Is a Fact Table?
A fact table stores measurable business activities or transactions.
Examples include:
- Sales amount
- Quantity sold
- Revenue
- Profit
- Orders
- Transactions
- Discount
- Cost
A sales table is a common example of a fact table.
What Is a Dimension Table?
A dimension table contains descriptive information used to analyze facts.
Examples include:
- Customers
- Products
- Employees
- Locations
- Departments
- Dates
- Categories
Dimension tables help answer questions such as:
- Which customer purchased the most?
- Which product generated the highest revenue?
- Which city produced the most sales?
- Which month performed best?
Example of a Power BI Data Model
Imagine a retail company with the following tables:
Sales Table
Contains:
- Order ID
- Product ID
- Customer ID
- Date ID
- Quantity
- Sales Amount
Product Table
Contains:
- Product ID
- Product Name
- Category
- Brand
Customer Table
Contains:
- Customer ID
- Customer Name
- City
- State
Date Table
Contains:
- Date
- Month
- Quarter
- Year
The Sales table becomes the fact table, while Product, Customer and Date become dimension tables.
This structure makes it easier to build reports such as:
- Sales by product
- Sales by city
- Monthly revenue
- Quarterly performance
- Customer-wise sales
Power Query vs Data Modelling
Beginners sometimes confuse Power Query with data modelling.
Both are important, but they perform different tasks.
| Power Query | Data Modelling |
|---|---|
| Cleans data | Organizes data |
| Removes unwanted records | Creates table relationships |
| Changes data types | Connects fact and dimension tables |
| Combines datasets | Defines how tables interact |
| Prepares raw data | Prepares data for analysis |
A typical Power BI workflow is:
Raw Data → Power Query → Data Model → DAX → Visualizations → Dashboard
This sequence is important for building efficient Power BI reports.
What Should You Learn After Data Modelling?
Once you understand data modelling, the next important Power BI topic is DAX.
DAX helps create calculations such as:
- Total Sales
- Total Profit
- Average Revenue
- Profit Margin
- Year-to-Date Sales
- Previous-Year Sales
- Growth Percentage
A strong data model makes DAX much easier to understand and implement.
A good learning sequence is:
Power Query → Data Modelling → DAX → Data Visualization → Dashboard Development
Frequently Asked Questions
1. What is data modelling in Power BI?
Data modelling in Power BI is the process of organizing tables and defining relationships between them so that data can be analyzed correctly.
2. What is a relationship in Power BI?
A relationship connects two tables using a common column such as Customer ID, Product ID or Date.
3. What is a star schema in Power BI?
A star schema is a data modelling structure where one central fact table connects to multiple dimension tables.
4. What is the difference between a fact table and a dimension table?
A fact table stores measurable business transactions, while a dimension table stores descriptive information such as customers, products, dates and locations.
5. Which relationship is commonly used in Power BI?
One-to-many is one of the most commonly used relationship types in Power BI analytical models.
6. Should I learn data modelling before DAX?
It is recommended. Understanding relationships and data structure makes DAX calculations easier to create and troubleshoot.
7. Is data modelling important for Power BI developers?
Yes. Data modelling is one of the core skills required for building accurate, scalable and efficient Power BI reports.
Final Thoughts
Data modelling is the foundation of an effective Power BI report.
While Power Query helps clean and transform information, data modelling defines how different tables work together.
Understanding concepts such as:
Relationships → Fact Tables → Dimension Tables → Star Schema → Date Tables
can help learners build more accurate and professional dashboards.
For anyone developing Power BI skills, data modelling should be learned before moving deeply into advanced DAX and dashboard development.
For learners looking for Power BI training in KPHB, combining theoretical knowledge with real-world datasets can help build practical business intelligence skills.