A student who wants to enter Data Analytics or Business Intelligence usually comes across two tools very quickly: Excel and Power BI.
Excel has been used for years for spreadsheets, calculations, reporting and business analysis. Power BI is designed more specifically for connecting data, building data models and creating interactive dashboards.
This creates an obvious question:
Should you learn Excel first, Power BI first, or both?
The simple answer is that both tools are useful, but they solve different types of problems.
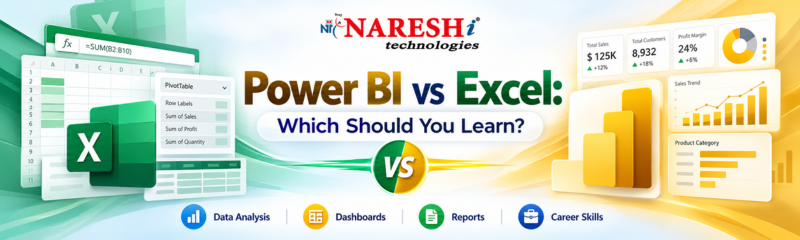
When comparing Power BI vs Excel, Excel is often better for spreadsheet-based calculations and quick analysis, while Power BI is stronger for interactive dashboards, data modelling and repeatable business reporting.
Power BI vs Excel: Quick Comparison
| Feature | Excel | Power BI |
|---|---|---|
| Main Use | Spreadsheets and calculations | Business intelligence and dashboards |
| Data Cleaning | Good | Strong with Power Query |
| Calculations | Excellent | Strong with DAX |
| Dashboard Creation | Basic to Moderate | Strong |
| Interactive Reports | Limited | Strong |
| Data Modelling | Moderate | Strong |
| Large Data Analysis | Depends on workbook | Better suited for analytical models |
| Multiple Data Sources | Possible | Designed for this |
| Report Sharing | File-based options | Built for report publishing/sharing |
| Beginner Friendly | Very High | High |
What Is Excel Mainly Used For?
Excel is a spreadsheet application used for storing, calculating and analysing data.
A business professional may use Excel for:
- Monthly sales reports
- Budgets
- Expense calculations
- Attendance records
- Financial analysis
- Inventory tracking
- Data cleaning
- PivotTables
- Charts
One of Excel’s biggest strengths is flexibility.
What Is Power BI Mainly Used For?
Power BI focuses more on analysing data and presenting it through interactive reports.
Instead of manually updating the same report repeatedly, Power BI can connect to different sources, transform data and build reusable dashboards.
A typical Power BI report might show:
- Total sales
- Monthly growth
- Profit
- Top products
- Regional performance
- Customer trends
Users can interact with the report using slicers and filters.
Power BI vs Excel: A Simple Business Example
Imagine a retail company receives sales reports from ten branches every week.
Using Excel
Someone may:
- Collect all files.
- Copy data into a master workbook.
- Clean the information.
- Create PivotTables.
- Update charts.
- Email the new report.
This works, especially when the amount of data is manageable.
Using Power BI
The company could create a reporting model that connects to the data source.
After refresh, dashboards can update based on the latest available data.
Users could then filter by:
- Branch
- Product
- Month
- Salesperson
- Category
- This makes Power BI particularly useful when reports need to be refreshed and analysed repeatedly.
Power Query: A Skill Useful in Both Tools
One important connection between Excel and Power BI is Power Query.
Power Query helps users clean and transform data.
For example, you may receive customer information containing:
- Duplicate rows
- Empty cells
- Incorrect date formats
- Multiple columns that should be combined
Power Query can help transform this data before analysis.
Common Power Query operations include:
- Removing duplicates
- Changing data types
- Splitting columns
- Merging tables
- Appending data
- Replacing values
Excel Formulas vs DAX
Another major difference appears in calculations.
Excel users commonly work with formulas such as:
- SUM
- IF
- COUNTIF
- VLOOKUP
- XLOOKUP
- INDEX and MATCH
- Power BI uses a formula language called DAX, or Data Analysis Expressions.
DAX can be used to create calculations such as:
- Total Revenue
- Total Profit
- Profit Margin
- Year-to-Date Sales
- Previous Month Sales
- Growth Percentage
At first, DAX may feel different from Excel formulas because calculations operate within a data model and filter context.
Which Tool Is Better for Dashboards?
For interactive business dashboards, Power BI usually offers more capabilities.
Excel can create charts and dashboards, but Power BI is designed specifically for business intelligence reporting.
Power BI allows users to combine:
- Charts
- Cards
- Tables
- Maps
- Slicers
- KPIs
into interactive report pages.
Should Beginners Learn Excel Before Power BI?
Basic Excel knowledge can be useful before starting Power BI, but you do not need to become an Excel expert first.
A good beginner foundation includes:
- Rows and columns
- Basic formulas
- Sorting and filtering
- Tables
- Simple PivotTables
After understanding these concepts, you can begin Power BI.
What Should a Power BI Beginner Learn?
A practical learning roadmap is:
1. Excel Basics
Understand structured data and simple calculations.
2. Power BI Desktop
Learn the interface and report views.
3. Power Query
Practise data cleaning and transformation.
4. Data Modelling
Understand relationships between tables.
5. DAX
Start with basic measures before moving to advanced calculations.
6. Visualization
Learn how to choose the right visual for the right business question.
7. Projects
Build complete dashboards using real datasets.
Power BI vs Excel: Which Is Better for Your Career?
| Career Area | Excel | Power BI |
|---|---|---|
| Data Analyst | Important | Very Important |
| BI Analyst | Useful | Very Important |
| Reporting Analyst | Important | Very Important |
| Finance Analyst | Very Important | Useful to Important |
| Business Analyst | Important | Useful |
| Sales Analyst | Important | Important |
| HR Analyst | Important | Important |
Beginner Project Idea: Sales Dashboard
A beginner can practise both tools using one sales dataset.
Your dataset might contain:
- Order Date
- Product
- Category
- Region
- Sales
- Quantity
- Profit
In Excel
Create:
- PivotTable
- Monthly Sales Chart
- Product Summary
- Region Report
In Power BI
Create:
- Total Sales KPI
- Sales Trend
- Sales by Region
- Product Performance
- Profit Analysis
- Interactive slicers
Frequently Asked Questions
1. Is Power BI better than Excel?
Neither tool is universally better. Excel is excellent for spreadsheets and calculations, while Power BI is stronger for interactive dashboards, data modelling and repeatable reporting.
2. Should I learn Excel before Power BI?
Basic Excel knowledge is helpful, but advanced Excel expertise is not compulsory before learning Power BI.
3. Can Power BI replace Excel?
Power BI does not completely replace Excel. Businesses often use both tools for different purposes.
4. Does Power BI require coding?
Power BI does not require traditional programming for beginners, but learners should understand Power Query and DAX.
5. Which tool is better for dashboards?
Power BI is generally more suitable for interactive business dashboards and reporting.
6. Is Excel useful for Data Analysts?
Yes. Excel continues to be useful for calculations, quick analysis and spreadsheet-based reporting.
7. Is Power BI useful for Data Analyst jobs?
Yes. Power BI is commonly associated with Data Analytics, Business Intelligence and reporting skills.
8. Is SQL needed for Power BI?
SQL is not compulsory for starting Power BI, but it becomes valuable when working with business databases.
9. Can non-IT students learn Power BI?
Yes. Power BI can be learned by students and professionals from commerce, management, engineering and other backgrounds.
10. Which should I learn first for Data Analytics?
Start with basic Excel and data concepts, then learn Power BI, SQL and practical reporting skills.
Final Thoughts
The Power BI vs Excel question should not be treated as an either-or decision.
Excel helps you work with spreadsheets, formulas and quick calculations.
Power BI helps you create interactive dashboards, data models and repeatable business reports.
For beginners, a practical sequence is:
Excel Basics → Power BI → Power Query → Data Modelling → DAX → Projects
Learn both tools for the work they do best.
More importantly, practise using business datasets and learn how to turn numbers into useful decisions.
For students, freshers and working professionals looking for structured dashboard practice, DAX, Power Query, data modelling and real-world reporting scenarios, power bi training in kphb can help build practical Business Intelligence skills.