Businesses generate data every day from sales, marketing, finance, operations, HR, customer service and many other departments.
But raw data alone is not very useful.
Someone has to organize it, analyse it and present it in a way that helps people make decisions.
This is where Power BI becomes useful.
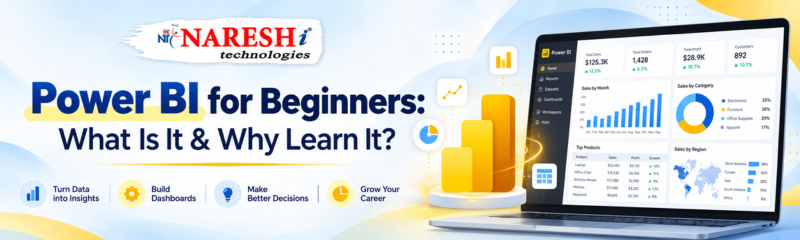
Power BI is a business intelligence and data visualization tool used to connect data, transform it, build reports and create interactive dashboards.
For beginners, it can be one of the easiest ways to enter the world of data analysis because it combines data preparation, reporting and visualization in one platform.
If you are a student, fresher or working professional wondering where to start with analytics, Power BI can be a practical skill to learn.
What Is Power BI?
Power BI is a tool used for analysing data and creating interactive reports and dashboards.
It can connect to different data sources such as:
- Excel files
- CSV files
- SQL databases
- Cloud applications
- Online services
- Business systems
After connecting the data, users can clean it, transform it and create visuals such as charts, tables, cards and dashboards.
The main goal of Power BI is simple:
Turn data into useful business insights.
How Does Power BI Work?
A typical Power BI workflow can be understood in five steps:
| Step | What Happens |
|---|---|
| 1. Connect | Import data from different sources |
| 2. Clean | Remove errors and prepare data |
| 3. Model | Create relationships between tables |
| 4. Visualize | Build charts, reports and dashboards |
| 5. Share | Publish reports for teams and decision-makers |
This process makes Power BI useful for both technical and non-technical professionals.
What Can You Do with Power BI?
Power BI can be used for many business tasks.
For example, a sales team can use it to track:
- Monthly revenue
- Product performance
- Sales by region
- Top customers
- Target vs achievement
A marketing team can use it to track:
- Campaign performance
- Leads
- Conversion rates
- Cost per lead
- Website traffic
An HR team can track:
- Employee attendance
- Attrition
- Department performance
- Hiring status
Finance teams can monitor:
- Expenses
- Budget performance
- Profitability
- Cash flow
This is why Power BI is useful across many industries.
Power BI for Beginners: What Should You Learn First?
A beginner does not need to learn everything at once.
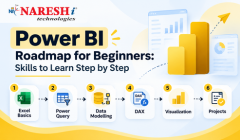
A practical learning order is:
1. Power BI Interface
Understand the workspace, report view, data view and model view.
2. Data Import
Learn how to connect Power BI with Excel, CSV and databases.
3. Power Query
Power Query is used to clean and transform data.
Beginners should learn how to:
- Remove duplicates
- Handle missing values
- Change data types
- Split columns
- Merge tables
- Append data
4. Data Modelling
Learn how tables are connected.
Important concepts include:
- Relationships
- Primary keys
- Fact tables
- Dimension tables
5. DAX
DAX stands for Data Analysis Expressions.
It is used to create calculations such as:
- Total Sales
- Profit
- Growth Percentage
- Running Total
- Year-to-Date values
6. Dashboard Design
Learn how to create clear and useful reports using charts, slicers, cards and tables.
What Skills Are Required for Power BI?
| Skill | Importance |
|---|---|
| Excel | Useful |
| Power Query | Very Important |
| Data Modelling | Very Important |
| DAX | Very Important |
| SQL | Useful to Important |
| Data Visualization | Very Important |
| Business Understanding | Important |
| Dashboard Design | Important |
For beginners, Power BI does not require advanced programming.
However, learning SQL and basic data concepts can make you more effective.
Power BI vs Excel
Many beginners ask whether Power BI is simply an advanced version of Excel.
Excel is excellent for calculations, spreadsheets and smaller analysis tasks.
Power BI is designed more for interactive reporting and dashboards.
| Feature | Excel | Power BI |
|---|---|---|
| Spreadsheets | Excellent | Limited |
| Dashboards | Basic to Moderate | Strong |
| Data Modelling | Limited | Strong |
| Large Data Handling | Moderate | Better suited |
| Interactive Reports | Limited | Strong |
| Automated Refresh | Limited | Stronger |
| DAX | Limited use | Core feature |
The two tools can also work together.
Why Should Students Learn Power BI?
Power BI is useful for students because it develops both technical and business skills.
While learning Power BI, students understand how to:
- Work with datasets
- Clean information
- Analyse trends
- Build dashboards
- Present insights
- Solve business problems
This can be useful for students from:
- B.Tech
- BCA
- BSc
- BCom
- MBA
- Engineering
- Commerce
- Management backgrounds
The key is to practise with real data instead of only watching tutorials.
Can Non-IT Students Learn Power BI?
Yes.
Power BI is one of the easier data tools for non-IT learners because it does not require advanced coding to begin.A commerce student can analyse sales or finance data.
An HR professional can create employee dashboards.
A marketing professional can analyse campaign performance.
An operations professional can track business KPIs.
The tool becomes more useful when you connect it to your existing domain knowledge.
What Projects Should Beginners Build?
Practical projects can help beginners understand Power BI better.
Some good project ideas include:
- Sales Dashboard
- HR Analytics Dashboard
- E-commerce Performance Dashboard
- Marketing Campaign Dashboard
- Financial Dashboard
- Customer Analysis Dashboard
- Inventory Dashboard
A strong project should not only look attractive. It should answer real questions.
For example:
- Which product generated the highest revenue?
- Which region is underperforming?
- What is the monthly growth rate?
- Which customer segment is most profitable?
- Good dashboards help users understand answers quickly.
Common Mistakes Power BI Beginners Make
Using too many visuals
More charts do not automatically make a better dashboard.
Ignoring data cleaning
Poor data leads to poor reports.
Learning DAX without understanding the data model
DAX becomes easier when your table relationships are correct.
Copying dashboard designs
Understand why each visual is used.
Focusing only on appearance
A dashboard should support business decisions, not just look attractive.
Frequently Asked Questions
1. Is Power BI easy for beginners?
Yes. Beginners can start with basic data import, Power Query and simple dashboards before moving into advanced DAX and data modelling.
2. Do I need coding for Power BI?
You do not need advanced programming. However, you should learn DAX and basic data concepts. SQL is also useful.
3. Is Power BI useful for freshers?
Yes. Power BI can help freshers build skills in reporting, data analysis and business intelligence.
4. Can commerce students learn Power BI?
Yes. Commerce students can use Power BI for finance, sales, reporting and business analysis.
5. Is Excel required before Power BI?
Excel knowledge is helpful but not compulsory. Basic spreadsheet understanding can make the learning process easier.
6. Is SQL important for Power BI?
SQL is useful because business data is often stored in databases. It can help you retrieve and prepare data more effectively.
7. What is DAX in Power BI?
DAX is a formula language used to create measures and calculations inside Power BI.
8. What is Power Query?
Power Query is used to clean, transform and prepare data before analysis.
9. What type of jobs use Power BI?
Power BI is used in roles such as Data Analyst, Business Intelligence Analyst, Reporting Analyst and other data-focused positions.
10. What should beginners practise in Power BI?
Beginners should practise data cleaning, modelling, DAX, dashboards and real business projects.
Final Thoughts
Power BI is a practical tool for anyone who wants to understand data and communicate insights clearly. For beginners, the best learning path is:
Data Import → Power Query → Data Modelling → DAX → Visualization → Projects
Do not rush directly into advanced dashboards.
Start with simple data. Understand how the numbers are connected. Then build reports that answer real business questions. The more projects you create, the easier it becomes to understand how Power BI is used in real-world situations.
For students and professionals looking for structured classroom guidance, practical dashboards, DAX practice and real-world reporting scenarios, power bi training in kphb can help learners build a stronger foundation in business intelligence and data visualization.