A beginner opening Power BI for the first time may see reports, relationships, Power Query, DAX, visuals and dashboards all at once. That can make the tool look more complicated than it actually is. The easiest way to learn Power BI is not to jump randomly between topics. Follow a proper sequence.
A practical Power BI roadmap for beginners should take you from understanding data to cleaning it, modelling it, creating calculations and finally building dashboards that answer real business questions.
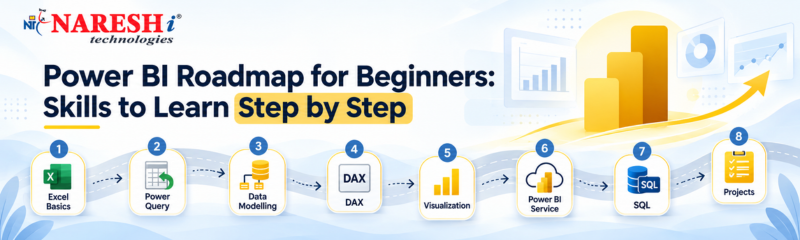
Power BI Roadmap at a Glance
| Stage | What to Learn |
|---|---|
| 1 | Excel and Data Basics |
| 2 | Power BI Desktop |
| 3 | Power Query |
| 4 | Data Modelling |
| 5 | DAX |
| 6 | Data Visualization |
| 7 | Power BI Service |
| 8 | SQL Basics |
Step 1: Understand Data Before Power BI
Before creating dashboards, understand how structured data works.
A clean dataset usually contains:
- Rows
- Columns
- Headers
- Dates
- Numerical values
- Categories
- IDs
Step 2: Learn Basic Excel
You do not need advanced Excel expertise before Power BI.
However, basic Excel knowledge is useful.
Learn:
- Tables
- Sorting
- Filtering
- Basic formulas
- PivotTables
- Data formatting
Excel helps beginners understand how business data is organised.
Step 3: Learn the Power BI Desktop Interface
The next step is becoming familiar with Power BI Desktop.
Beginners should understand the main areas:
Report View
Used to create charts, tables, cards and dashboards.
Data View
Used to inspect imported data.
Model View
Used to understand relationships between tables.
Step 4: Master Power Query
Power Query is one of the most important skills in the Power BI learning roadmap.
Real-world data is rarely perfect.
You may find:
- Duplicate records
- Blank values
- Incorrect data types
- Unnecessary columns
- Inconsistent text
- Multiple files that need combining
Power Query helps clean and transform this information.
Important topics include:
- Remove columns
- Remove duplicates
- Replace values
- Change data types
- Split columns
- Merge queries
- Append queries
- Group data
- Rename columns
Do not treat Power Query as an optional topic.
Step 5: Learn Data Modelling
This is where Power BI becomes more than a simple visualization tool.
Data modelling means connecting multiple tables correctly.
Imagine you have three tables:
- Sales Table
- Customer Table
- Product Table
Instead of keeping everything in one huge table, Power BI can create relationships between them.
Beginners should understand:
- Primary keys
- Foreign keys
- Relationships
- One-to-many relationships
- Fact tables
- Dimension tables
- Star schema
A good data model makes DAX easier and reports more reliable.
Step 6: Learn DAX Step by Step
DAX stands for Data Analysis Expressions.
It is used to create calculations in Power BI.
Beginners should not start with complicated DAX formulas.
Start with basic measures.
Examples include:
- Total Sales
- Total Profit
- Average Sales
- Order Count
- Profit Margin
Then progress toward:
- Previous Month Sales
- Year-to-Date Sales
- Growth Percentage
- Running Total
- Time Intelligence
Step 7: Learn Data Visualization
A Power BI professional is not someone who simply knows how to add charts.
You should know which visual answers which question.
For example:
| Business Question | Suitable Visual |
|---|---|
| Sales trend over time | Line Chart |
| Sales by category | Bar Chart |
| Total revenue | Card |
| Regional distribution | Map |
| Detailed transactions | Table |
| Share by category | Donut/Pie Chart when appropriate |
Step 8: Learn Dashboard Design Principles
A professional report should be easy to read.
Follow simple principles:
- Keep important KPIs at the top
- Use consistent formatting
- Avoid too many colors
- Keep enough white space
- Use clear titles
- Avoid unnecessary charts
- Use slicers only where useful
Think about the user viewing the dashboard.
Step 9: Learn Power BI Service
After learning Power BI Desktop, understand how reports are published and shared.
Power BI Service introduces concepts such as:
- Workspaces
- Reports
- Dashboards
- Dataset refresh
- Sharing
- Collaboration
Beginners do not need to learn administration immediately.
Step 10: Learn Basic SQL
SQL is not compulsory for your first Power BI dashboard.
But it becomes very useful for real-world data roles.
Many companies store information in databases rather than Excel files.
Important SQL topics include:
- SELECT
- WHERE
- ORDER BY
- GROUP BY
- JOIN
- Aggregate functions
- Subqueries
A Power BI learner with SQL knowledge can work more effectively with business databases.
Common Power BI Learning Mistakes
Learning only visuals
Power Query, modelling and DAX are equally important.
Memorising DAX formulas
Understand the logic behind calculations.
Ignoring projects
Practical work helps concepts stay in memory.
Building crowded dashboards
More visuals do not mean better reporting.
Skipping business understanding
A beautiful dashboard is useless if it does not answer a useful question.
Frequently Asked Questions
1. What should I learn first in Power BI?
Start with data basics and Power BI Desktop, then learn Power Query, data modelling, DAX and visualization.
2. Do I need Excel before Power BI?
Basic Excel knowledge is helpful but advanced Excel is not compulsory.
3. Is SQL required for Power BI?
Not for starting, but SQL becomes valuable when working with business databases.
4. Is DAX difficult for beginners?
Basic DAX is manageable when you understand your data model. Start with simple measures before learning advanced calculations.
5. How many Power BI projects should a beginner build?
Three to five meaningful projects can provide good practical exposure if you understand them thoroughly.
6. What is the most important skill in Power BI?
There is no single skill. Power Query, data modelling, DAX and visualization work together.
7. Can non-IT students learn Power BI?
Yes. Students from commerce, management, finance and other backgrounds can learn Power BI.
8. Is Power BI useful for Data Analyst roles?
Power BI is widely associated with reporting, Business Intelligence and Data Analytics work.
9. Should I learn Power BI Service?
Yes. Once you are comfortable with Power BI Desktop, learn how reports are published, refreshed and shared.
10. What should I learn after Power BI?
Depending on your career goal, you can strengthen SQL, Excel, Data Analytics, cloud data tools or other Business Intelligence technologies.
Final Thoughts
A strong Power BI roadmap for beginners does not start with advanced DAX or complicated dashboards.
Build your skills in order:
Data Basics → Excel → Power BI Desktop → Power Query → Data Modelling → DAX → Visualization → Power BI Service → SQL → Projects
The most important part is practice.
- Take real datasets and turn them into useful reports.
- Try to explain what your dashboard shows and what business decision someone could make from it.
- That is when Power BI moves from being just another software tool to becoming a practical career skill.
- For students, freshers and working professionals who want structured guidance in Power Query, DAX, data modelling, dashboards and practical projects, power bi training in kphb can help build a stronger foundation in Business Intelligence and Data Analytics.