What Is El Niño? How Scientists Measure It Using Ocean Data, Satellites and AI
Have you ever wondered why some years bring unusual rainfall, droughts, or extreme temperatures in different parts of the world? One important climate pattern behind these changes is El Niño.
Scientists study El Niño by collecting ocean temperature readings, satellite observations, wind measurements, and historical climate data. Today, computer models and artificial intelligence (AI) also help researchers understand these patterns and improve climate predictions. Let’s explore how it works.
Table of Contents
- What Is El Niño?
- How Do Scientists Measure El Niño?
- How Do Satellites and AI Help?
- Technologies and Tools Used
- Real-World Applications
- How to Build an El Niño Data Analysis Project
- Common Mistakes to Avoid
- Learning Path for Students and Freshers
- Frequently Asked Questions
What Is El Niño?
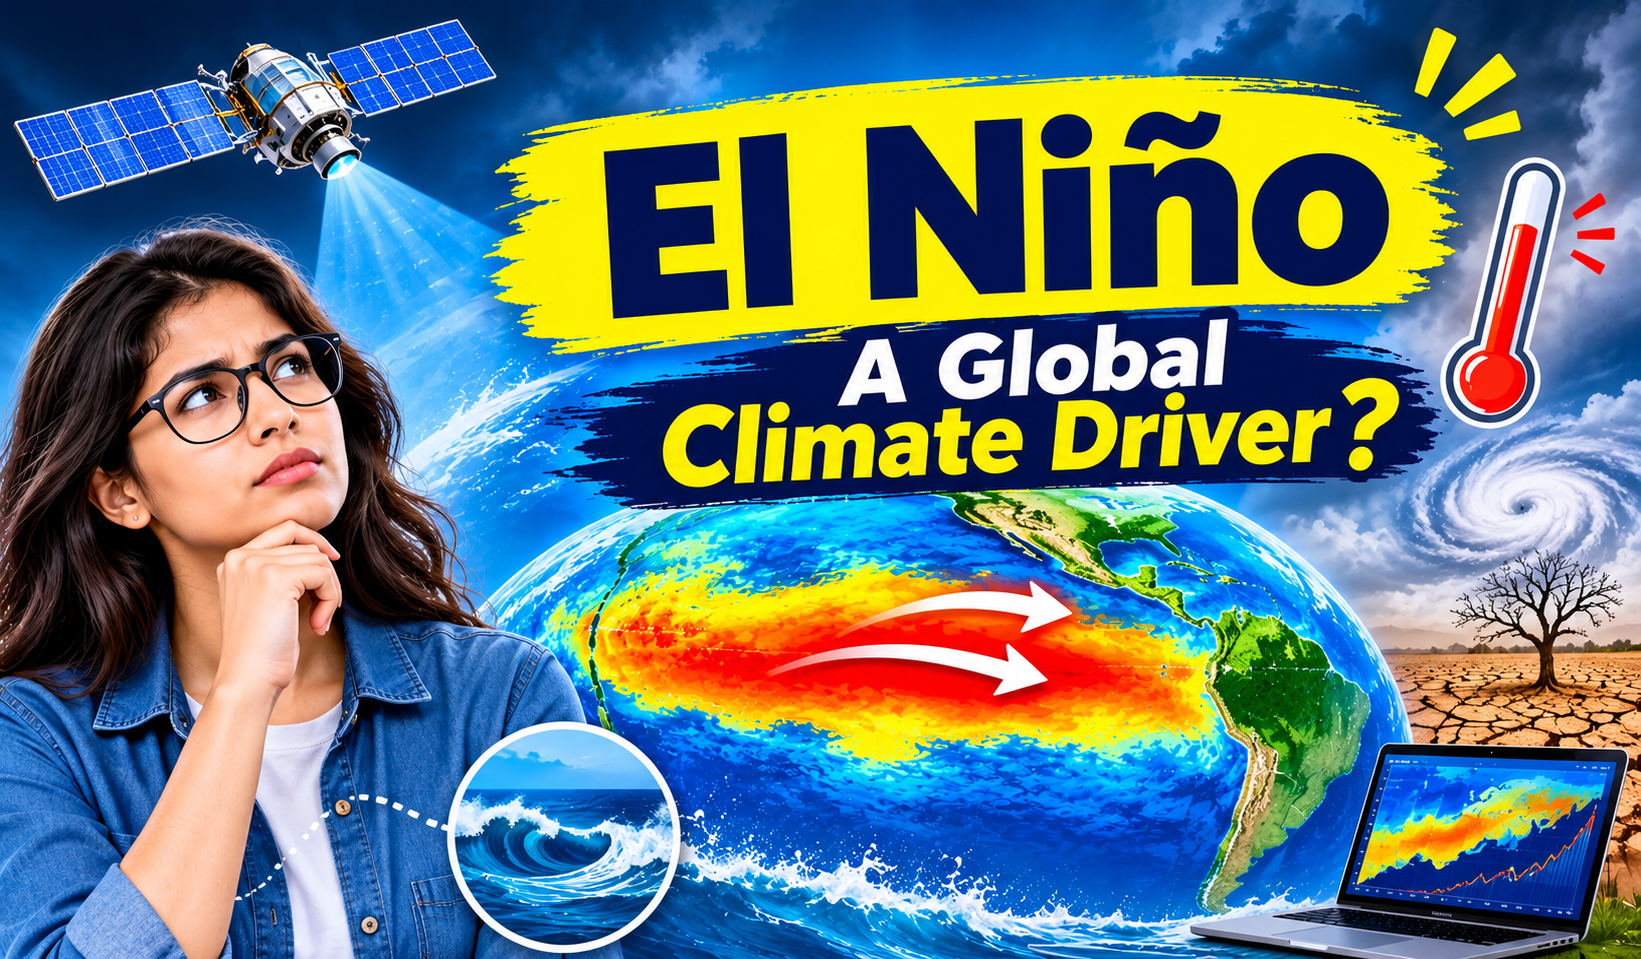
El Niño is a climate pattern that occurs when sea surface temperatures become warmer than usual across parts of the central and eastern tropical Pacific Ocean.
Normally, trade winds push warm surface water towards the western Pacific. During El Niño, these winds weaken or sometimes change direction. Warm water spreads towards the central and eastern Pacific, affecting ocean temperatures, air pressure, and rainfall patterns.
These ocean and atmospheric changes can influence weather in different regions. Their effects are not identical everywhere and can vary from one event to another.
How Do Scientists Measure El Niño?
Scientists do not identify El Niño using temperature alone. They study several ocean and atmospheric conditions together.
Step 1: Measuring Ocean Temperature
Researchers monitor sea surface temperatures in the Niño 3.4 region of the Pacific Ocean. They compare current temperatures with long-term average conditions to identify unusual warming.
Step 2: Calculating Temperature Differences
Scientists calculate how much warmer or cooler the ocean is compared with its average temperature. This difference is called a temperature anomaly.
The Oceanic Niño Index (ONI) has traditionally been used to monitor these changes. NOAA also introduced the Relative Oceanic Niño Index (RONI) for operational monitoring in 2026.
Step 3: Monitoring Wind and Air Pressure
Scientists observe trade winds and atmospheric pressure to understand whether the atmosphere is responding to ocean warming. This ocean-atmosphere connection is important for identifying El Niño conditions.
Step 4: Analysing Historical Data
Researchers compare current observations with previous El Niño events to understand how the pattern is developing and what weather changes may follow.
How Do Satellites and AI Help?
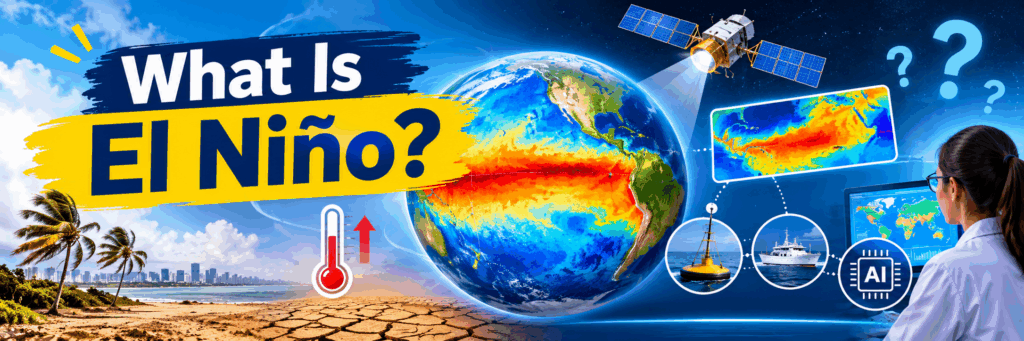
Satellites measure sea surface temperatures and monitor large-scale ocean conditions from space. Ocean buoys collect information such as water temperature, wind speed, and atmospheric pressure. Argo floats and research ships provide additional measurements.
AI and Machine Learning help researchers process large datasets, recognise patterns, and support climate forecasting. Computer models combine ocean and atmospheric observations to estimate how conditions may change.
AI supports forecasting, but scientists still use established climate indices and expert analysis to assess El Niño.
Technologies and Tools Used
Technology | Purpose |
Python | Analysing climate datasets |
Pandas | Cleaning and organising data |
NumPy | Numerical calculations |
Matplotlib | Creating temperature and rainfall charts |
Machine Learning | Identifying patterns in historical data |
Power BI | Creating climate dashboards |
Satellite Data | Monitoring ocean conditions |
These technologies help students understand how raw environmental data can become useful analytical information.
Real-World Applications of El Niño Analysis
El Niño monitoring supports decisions across several sectors.
Agriculture: Rainfall forecasts help farmers plan irrigation and prepare for possible dry conditions.
Water Management: Climate information can help authorities assess rainfall risks, reservoir levels, and water availability. For Hyderabad, local rainfall, reservoir storage, groundwater, and demand also matter; El Niño alone cannot determine the city’s water supply.
Disaster Preparedness: Climate analysis can support preparation for droughts, floods, and other weather-related risks.
Fisheries: Changes in ocean temperature can affect marine ecosystems and fishing activities.
How to Build an El Niño Data Analysis Project
Students can create a beginner-friendly project using historical ocean temperature data.
Step 1: Collect historical sea surface temperature data.
Step 2: Load and organise the dataset using Python and Pandas.
Step 3: Calculate temperature differences from average conditions.
Step 4: Use Matplotlib to create charts showing temperature changes over time.
Step 5: Compare the results with historical El Niño periods.
Step 6: Build a simple Power BI dashboard to display the findings.
This project helps learners connect Python, Data Analytics, and climate science through real-world data.
Common Mistakes to Avoid
Beginners should avoid these common mistakes:
- Using incomplete or unreliable climate datasets.
- Confusing daily temperature changes with long-term climate patterns.
- Ignoring wind and atmospheric pressure observations.
- Assuming every El Niño event creates the same weather impacts.
- Treating AI predictions as guaranteed outcomes.
Understanding these points helps learners develop more accurate data analysis projects.
Learning Path for Students and Freshers
Students interested in climate data analysis can follow this learning sequence:
- Learn Python programming fundamentals.
- Understand basic statistics and probability.
- Practise data analysis using Pandas and NumPy.
- Learn data visualisation using Matplotlib.
- Explore Machine Learning concepts.
- Build projects using real-world climate datasets.
Practical experience with datasets helps students understand how Data Science is applied beyond traditional business applications.
Frequently Asked Questions
What causes El Niño?
El Niño develops when trade winds weaken and warmer-than-usual surface water spreads across parts of the tropical Pacific Ocean.
How do scientists identify El Niño?
They monitor ocean temperatures, wind patterns, atmospheric pressure, and established climate indices.
Does AI help predict El Niño?
Yes. AI and computer models can analyse large climate datasets and support forecasts of changing ocean and atmospheric conditions.
Can El Niño affect India?
Yes. It can influence India’s monsoon patterns, but its effects vary. Other climate conditions also influence seasonal rainfall.
Can students build an El Niño analysis project?
Yes. Students can use Python, Pandas, NumPy, and Power BI to analyse historical ocean temperature data and create visual reports.
Conclusion
El Niño is an important climate pattern that connects ocean temperatures, wind conditions, and atmospheric changes. Scientists use satellites, ocean sensors, climate indices, and computer models to monitor its development. AI and Machine Learning are adding new ways to analyse large climate datasets and support forecasting.
Learning Python, Statistics, Data Analytics, and Machine Learning gives students a useful foundation for exploring real-world applications of Data Science.
Follow NareshIT for more technology updates and learning insights.